Altium Designer Panels Reference
Contents
Main article: Working with Panels
Workspace panels are an essential part of the Altium Designer environment. Editor-specific panels provide an alternate view into the data being edited, while system-wide panels, like the Projects panel, give access to design data across multiple editors.
When the application opens for the first time a number of panels will already be open. Some panels, including the Files and Projects panels, will appear grouped and docked to the left side of the application window. Others, including the Libraries panel will be in pop-out mode and appear as buttons on the right-hand border of the application window. Hover over, or click on a button to display these panels.
At the bottom right of the Altium Designer window there are a buttons that provide quick access to the available workspace panels, in context with the document editor you are currently using.
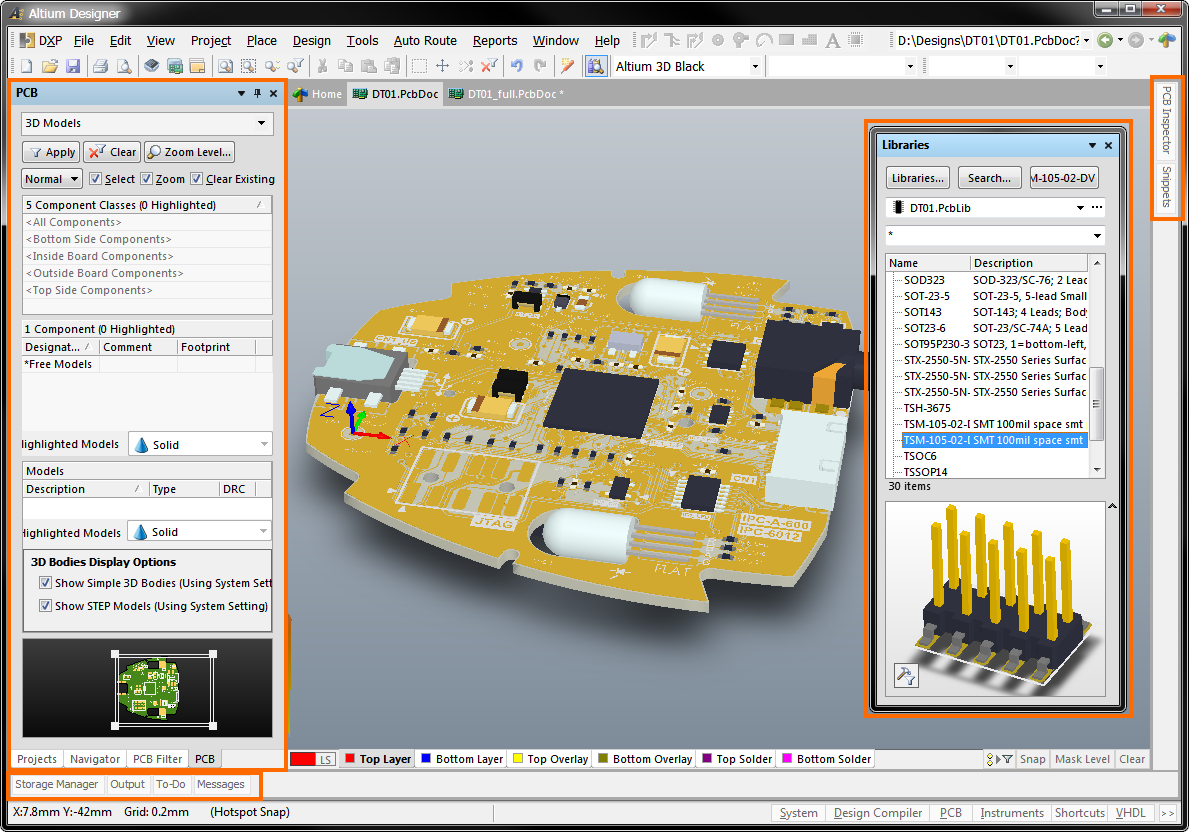
Altium Designer with docked panels on the left, pop-out panels on the right and bottom of the workspace, and a floating panel.
Panels are grouped into the following categories, use the links to learn more about a specific panel.
CAM Editor Panel
| Panel | Function |
|---|---|
| The CAMtastic panel provides quick access to the list of layers that are available in the current CAM document, and also enables you to view design-related information arising from commands including object querying, netlist extraction and Design Rule Checking (DRC). |
Design Compiler Panels
| Panel | Function |
|---|---|
| The Compile Errors panel is used to display detailed information about the offending object(s) associated with a Compiler-specific message being cross-probed from the Messages panel. | |
| The Compiled Object Debugger panel enables you to view detailed information about an object or document selected in the Navigator panel, or to interrogate an offending object selected in the Compile Errors panel. | |
| The Differences panel is used to display all logical differences that have been found by the Comparator when comparing design documents. | |
| The Navigator panel allows you to browse either the compiled active source document, or all compiled source documents in the active project. The source document(s) can be schematic and/or HDL in nature. The panel utilizes the connective model of the design, created upon compilation, as its foundation for navigation. |
Embedded Panels
| Panel | Function |
|---|---|
| The Breakpoints panel provides information on all breakpoints that are currently defined - either within the open source code documents for any embedded project or in one of the memory address spaces associated with a processor whose embedded code is currently being debugged. | |
| The Call Stack panel provides information about which line of source code the debugger is next going to execute and which function that line of code resides in. If a sequence of function calls have been made to reach the current line of code, these calls will be displayed as a call stack. | |
| The Code Explorer panel provides a visual summary of all identifiers (Define statements, Variables, Routines (functions) or Labels) that are used in the active source document (*.C, *.asm, *.h) for an embedded software project (*.PrjEmb). | |
| The Cross References panel enables you to quickly locate all occurrences of a variable, function or procedure, within the source code documents of an embedded project. | |
| The Debug Console panel provides a history of the current debug session, in terms of the commands issued and the lines of code executed. The panel also offers command-line debugging of the embedded code. | |
| The Evaluate panel is used to quickly determine the current value of a variable or expression in the active high-level source code document (*.C) currently being debugged. | |
| The various memory panels available for a processor enable you to interrogate the different memory spaces associated to that processor, concurrently. | |
| The Registers panel allows you to interrogate the content of registers within the core processor currently being debugged. You can also change the values of registers on-the-fly as you debug. | |
| The RTOS panel enables you to interrogate the state and operation of the Real Time Operating System, as you debug the active RTOS embedded project. | |
| The Watches panel enables you to create and display a list of watch expressions, allowing you to keep track of variable/expression values as you single-step debug the source code of an embedded software project. |
Instrument-Rack Panels
| Panel | Function |
|---|---|
| The Instrument Rack - NanoBoard Controllers panel is used to contain and display the NanoBoard Controller instruments associated with NanoBoards detected in the NanoBoard chain. | |
| The Instrument Rack - Hard Devices panel is used to contain and display hard device instruments detected in the Hard Devices chain. | |
| The Instrument Rack - Soft Devices panel is used to contain and display soft device instruments detected in the Soft Devices chain. These devices can include processor cores and any of the virtual instruments - frequency generators, frequency counters, digital I/O modules and logic analyzers. |
Other Instrument Panels
| Panel | Function |
|---|---|
| The LAX panel allows you to view the data captured by a Logic Analyzer instrument. It is also used to configure triggering and other Capture Control options. | |
| The Pin States panel is associated with a physical FPGA device, providing information about the mapping of interface ports in the source FPGA design to the physical pins of the FPGA device in which the design is currently running. You can also monitor the state of all physical pins of the associated FPGA device, in real time. | |
| The Debug panel is available for an OCD-version MCU, providing access to that processor's internal registers and memory spaces, as well as providing a disassembled view of the embedded software running within. |
PCB Editor and PCB Library Editor Panels
| Panel | Function |
|---|---|
| The 3D Visualization panel displays up to three simultaneous 3D views including cross-sections and a floating Board Insight. The 3D Visualization panel displays are shown based on the position of the cursor in the main window. | |
| The Board Insight panel provides detailed information about any objects currently under the cursor. Briefly pause the cursor over PCB objects in the design editor window to update the contents. | |
| Collaborate, Compare and Merge | The Collaborate, Compare and Merge panel is command-central for performing a copper comparison between two versions of the same PCB design. |
| The PCB panel allows you to browse the current PCB design using various filter modes to determine which object types or design elements are listed, highlighted or selected. It also has editing modes for certain object types or design elements that provide you with specific controls on the panel for editing procedures. | |
| The PCB List panel allows you to display design objects from the active document in tabular format, enabling you to quickly inspect and modify object attributes. When used in conjunction with the PCB Filter panel, it enables you to display just those objects falling under the scope of the active filter - allowing you to target and edit multiple design objects. | |
| The PCB Filter panel allows you to apply a filtered view to the objects in the PCB workspace, through the creation of logical queries. Objects that pass the filter can be selected and edited, with all other objects being masked (not editable). | |
| The PCB Inspector panel displays the properties of all objects currently selected in the PCB workspace. Used in conjunction with appropriate filtering, the panel can be used to make changes to multiple objects in a single edit action. Its natural partner is the PCB Filter panel. | |
| The PCB Library panel enables you to browse component footprints stored in the active PCB library document and edit their properties. When a PCB Library document is active, the panel populates with information about the footprint currently selected in that library. The panel right-click menu supports passing changes made to footprints to open PCB design document(s). | |
| The PCBLIB List panel allows you to display design objects associated with one or more PCB component footprints in tabular format, enabling you to quickly inspect and/or modify object attributes. When used in conjunction with the PCBLIB Filter panel, it enables you to display just those objects falling under the scope of the active filter - allowing you to target and edit multiple design objects. | |
| The PCBLIB Filter panel allows you to construct filters through the creation of logical queries. A defined filter can then be applied to the active PCB component footprint, or all component footprints in the active PCB library, allowing you to select and edit multiple objects. | |
| The PCBLIB Inspector panel enables you to interrogate and edit the properties of one or more design objects in the active PCB component footprint (or all component footprints in the active PCB library). Used in conjunction with appropriate filtering, the panel can be used to make changes to multiple objects of the same kind, from one convenient location. |
Schematic Editor and Schematic Library Editor Panels
| Panel | Function |
|---|---|
| The Sheet panel provides a mini-viewer for the active document, allowing you to pan and zoom the actual design document in the design editor window, using the available controls in the panel. | |
| The SCH Inspector panel enables you to interrogate and edit the properties of one or more design objects in the active schematic document (or all open schematic documents). Used in conjunction with appropriate filtering, the panel can be used to make changes to multiple objects of the same kind. | |
| The SCH Filter panel allows you to construct filters through the creation of logical queries. A defined filter can then be applied to the active schematic document, or all open schematic documents, allowing you to select and edit multiple objects. | |
| The SCH List panel allows you to display design objects from one or more documents in tabular format, enabling you to quickly inspect and/or modify object attributes. When used in conjunction with the SCH Filter panel, it enables you to display just those objects falling under the scope of the active filter - allowing you to target and edit multiple design objects. | |
| The SCH Library panel enables you to peruse through, and make changes to, the components stored in the active schematic library document. The panel also offers the ability to pass on any changes made to components in the library directly to the schematic design document, and also to define model linking for a component. | |
| The SCHLIB Inspector panel enables you to interrogate and edit the properties of one or more design objects in the active schematic component (or all components in the active schematic library). Used in conjunction with appropriate filtering, the panel can be used to make changes to multiple objects of the same kind. | |
| The SCHLIB Filter panel allows you to construct filters through the creation of logical queries. A defined filter can then be applied to the active schematic library component, or all components in the active schematic library, allowing you to select and edit multiple objects. The visual display of objects can be specified based on those that match the search criteria of the filter, and those that do not. | |
| The SCHLIB List panel allows you to display design objects associated with one or more schematic components in tabular format, enabling you to quickly inspect and/or modify object attributes. When used in conjunction with the SCHLIB Filter panel, it enables you to display just those objects falling under the scope of the active filter - allowing you to target and edit multiple design objects. |
Scripting Panels
| Panel | Function |
|---|---|
| The Breakpoints panel provides information on all breakpoints that are currently defined in all open script files (irrespective of the parent script project (*.PrjScr) they belong to), as well as providing commands for adding, enabling, disabling and deleting selected breakpoints as required. | |
| The Call Stack panel enables you to view the chain of procedure/function calls that has led to the current point of execution in the script being debugged. | |
| The Code Explorer panel provides a visual summary of all identifiers (variables, functions and procedures) that are used in the active script document (*.pas, *.vbs, *.js, *.tcl, *.bas). | |
| The Object Inspector panel enables you to interrogate and edit the properties and events of components in the active script form. | |
| The Tool Palette panel provides a range of visual and non-visual components with which to build script forms when writing scripts using DelphiScript (*.pas), VBScript (*.vbs) or JavaScript (*.js). | |
| The Watch List panel enables you to create and display a list of watch expressions, allowing you to keep track of variable/expression values as you single-step debug the current script document. |
Signal Integrity Panel
| Panel | Function |
|---|---|
| The Signal Integrity panel is the control center for performing signal integrity analysis on a design. It enables you to screen all nets in a design, against various defined signal integrity rules, in order to quickly identify problematic nets. These nets can then be analyzed in greater detail by running fast reflection and crosstalk analyses. The ability to add virtual terminations allows you to ascertain what additional circuitry need be added to the design to resolve these problem areas and hence obtain the most efficient signal integrity performance. |
Sim Data Panel
| Panel | Function |
|---|---|
| The Sim Data panel enables you to add waveforms from the available source data to the active wave plot. It also allows you to obtain measurement information based on the selected waveform and/or use of measurement cursors. |
System Panels
| Panel | Function |
|---|---|
| The Clipboard panel stores and displays a copied objects that can be added (pasted) to Altium Designer documents at any stage, allowing for multiple copy/paste operations. | |
| The Favorites panel stores and provides easy access to custom views, consisting of position and zoom, of your project documents. Once a view is saved as a favorite, you can call it up at any time from this panel and the view will be loaded into the design editor window. | |
| The Files panel provides a central area from where you can open existing projects and documents, or create new ones. | |
| The Libraries panel enables you to browse and place components from the libraries currently available in Altium Designer. All library types are supported, including browsing and placing Altium Vault components (introduced in Altium Designer 14.3). | |
| Whether compiling a project, running a design rule check for the active PCB document, performing a mixed signal simulation, or using any of the other message-enabled features of the software, the Messages panel provides an intelligent way of listing any warnings and/or errors that may be present, as well as any status information. | |
| The Output panel provides detailed information about all stages of the Process Flow when compiling, synthesizing, building and ultimately downloading the chosen FPGA design to the target physical device. The information displayed in the panel depends on the activity being performed. | |
| The Projects panel displays all projects that are currently open, along with their constituent documents and the VCS Revision status of each document. Any open documents that have not been created as part of a project or added to an existing open project will also be listed. | |
| The Storage Manager panel allows you to navigate the active project in terms of its file storage in Windows, and perform document management tasks, such as file renaming. The panel also provides access to the local history feature for documents, as well as version control. | |
| The To-Do panel lists all To-Do items that are currently defined for the active project. A To-Do item is used as a reminder for a task that needs to be carried out in relation to a document at a later stage. |
VHDL Panels
| Panel | Function |
|---|---|
| The Breakpoints panel provides information on all breakpoints that are currently defined in all open VHDL source files (irrespective of the parent FPGA project (*.PrjFpg) they belong to), as well as providing commands for enabling, disabling and deleting selected breakpoints as required. | |
| The Code Explorer panel provides a visual summary of all entities and architectures (and identifiers therein) declared in the active VHDL source document (*.VHD, *.VHDTST) for an FPGA project (*.PrjFpg). | |
| The Simulation panel allows you to browse the VHDL hierarchy of the active FPGA project currently under simulation. For each specific area of the hierarchy - testbench, design under test and component instantiations within the design - you can interrogate the values of local signals and variables, as well as control whether data for those signals is collected and corresponding waveforms displayed. | |
| The VHDL Watches panel enables you to create and display a list of watch expressions, allowing you to keep track of signal values as you single-step debug the VHDL source code of your FPGA project. |
Wave Panel
| Panel | Function |
|---|---|
| The Wave panel enables you to jump to transitions for the focused waveform, when viewing digital waveforms associated with a logic analyzer instrument. It also allows you to add and remove additional views for selected base waveforms. |