Pie Chart
Old Content - visit altium.com/documentation
Parent page: Sch Dialogs
Summary
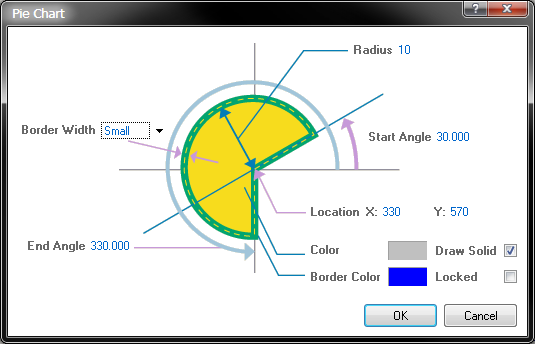
The Pie Chart dialog allows you to modify the graphical look and feel of the pie chart object.
Access
The Pie Chart dialog can be accessed prior to entering placement mode, from the Schematic – Default Primitives page of the Preferences dialog. This allows the default properties for the pie chart object to be changed, which will be applied when placing subsequent pie charts.
During placement, the dialog can be accessed by pressing the Tab key.
After placement, the dialog can be accessed in one of the following ways:
- Double-clicking on the placed pie chart object.
- Placing the cursor over the pie chart object, right-clicking and choosing Properties from the context menu.
Options/Controls
- Radius – this field shows the current radius of the pie chart. Edit the value in this field to change the radius directly.
- Border Width – this field sets the width of the border used for the outline of the pie chart. Available widths are:
Smallest,Small,Medium, andLarge. - Start Angle – this field shows the start angle of the pie piece in degrees from the horizontal.
- End Angle – this field shows the end angle of the pie piece in degrees from the horizontal.
- Location X – shows the current X (horizontal) coordinate of the center of the pie chart. Edit the value to change the position of the object in the horizontal plane.
- Location Y – shows the current Y (vertical) coordinate of the center of the pie chart. Edit the value to change the position of the object in the vertical plane.
- Color – click the color sample to change the color used to fill the pie chart. You must have the Draw Solid option enabled for the pie chart to be filled.
- Border Color – click the color sample to change the color used for the outline of the pie chart.
- Draw Solid – enable this option to have the pie chart filled with the color set in the Color field. If this option is disabled, the pie chart is drawn in outline only.
- Locked – enable this option to protect the pie chart from being edited graphically. Lock a pie chart whose position and/or size is critical. If you try to edit a pie chart that is locked, you will be informed of the locking and asked if you wish to proceed with the action. If this option is disabled, the pie chart can be freely edited without confirmation.